BEAT THE COUCH · THE LEDGER
LIVE FROM THE GLOBAL LEDGER · UPDATED ON EVERY LOAD
Players are handed $10,000 and two secret years of real S&P 500 daily history, with one button: buy or sell. Their opponent buys on day one and never sells. The couch has won 62% of 120,800 games so far, and roughly two thirds of the wins humans do get fail a 1,000-monkey skill audit. This page is the whole ledger.
Live from the global ledger, which counts every settled game. The findings and charts below are cut from a fixed export of the run table taken on August 28, 2026, at 100,087 games, so that the numbers behind them stay checkable.
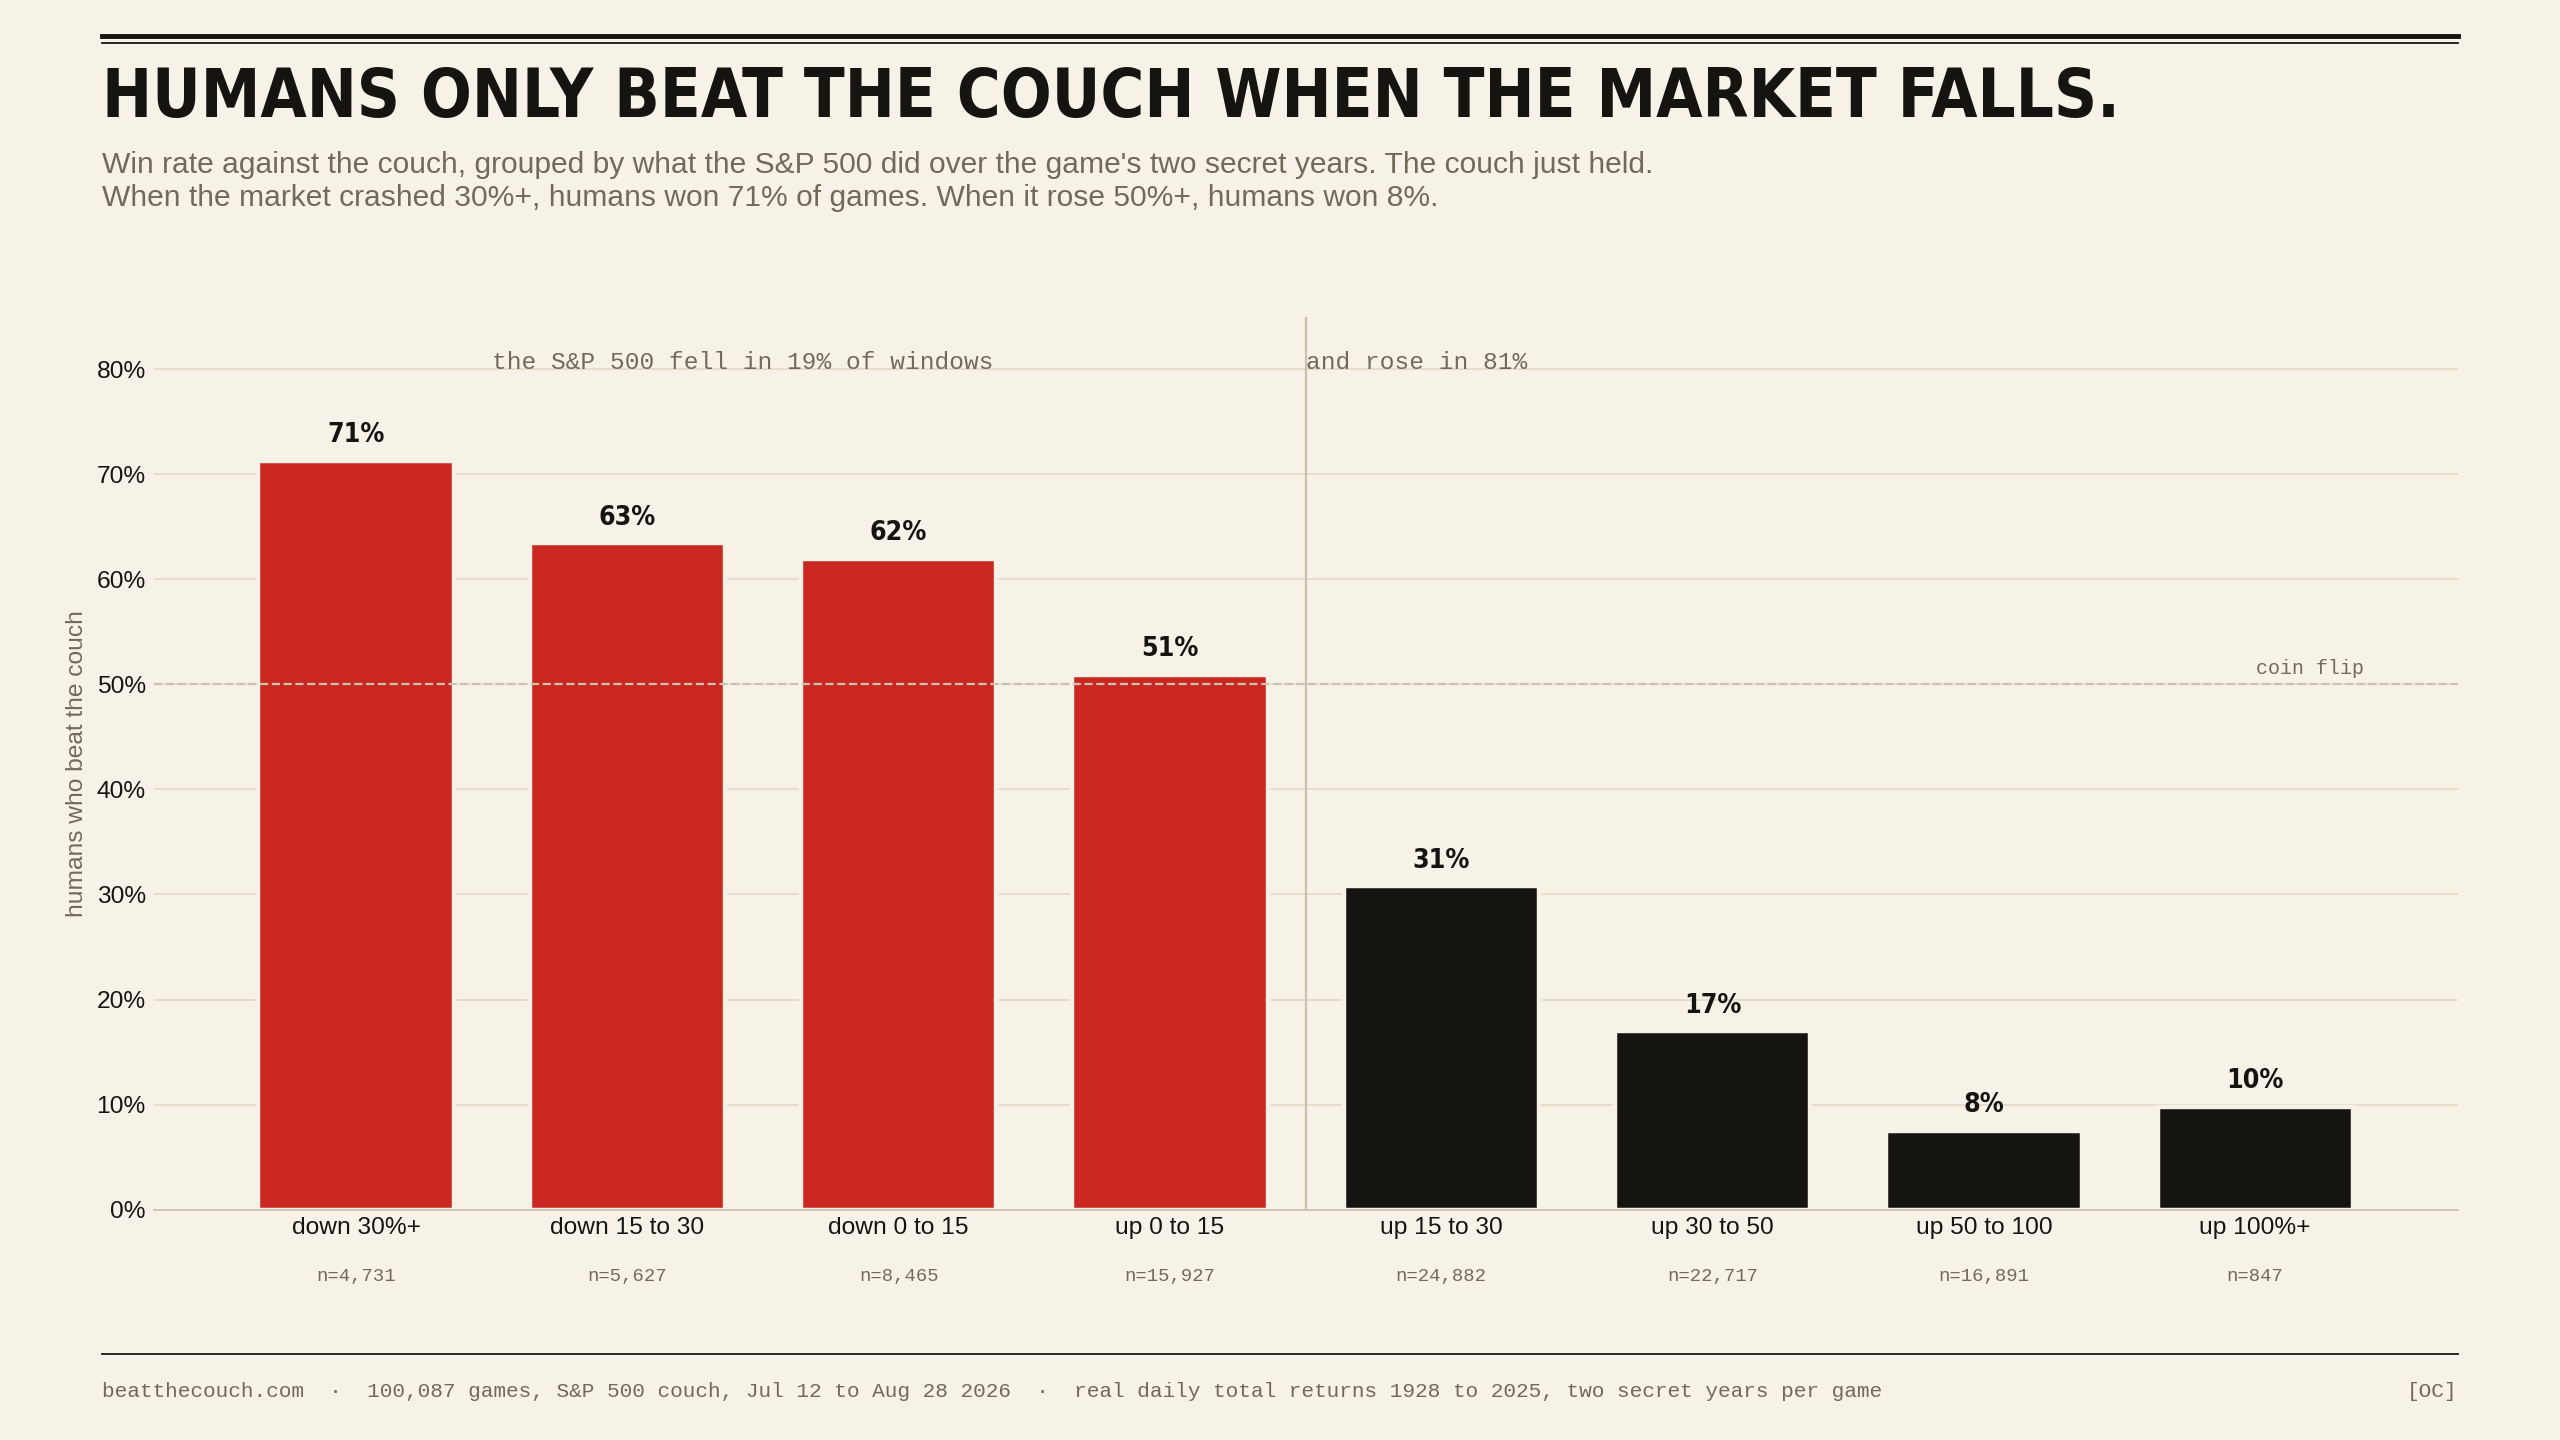
Players beat the couch in 65% of games where the market fell over the window, and 26% where it rose. When it crashed 30% or more: 71%. When it rose 50% or more: 8%. The market fell in 19% of windows, which is roughly how often market timing has anything to do.
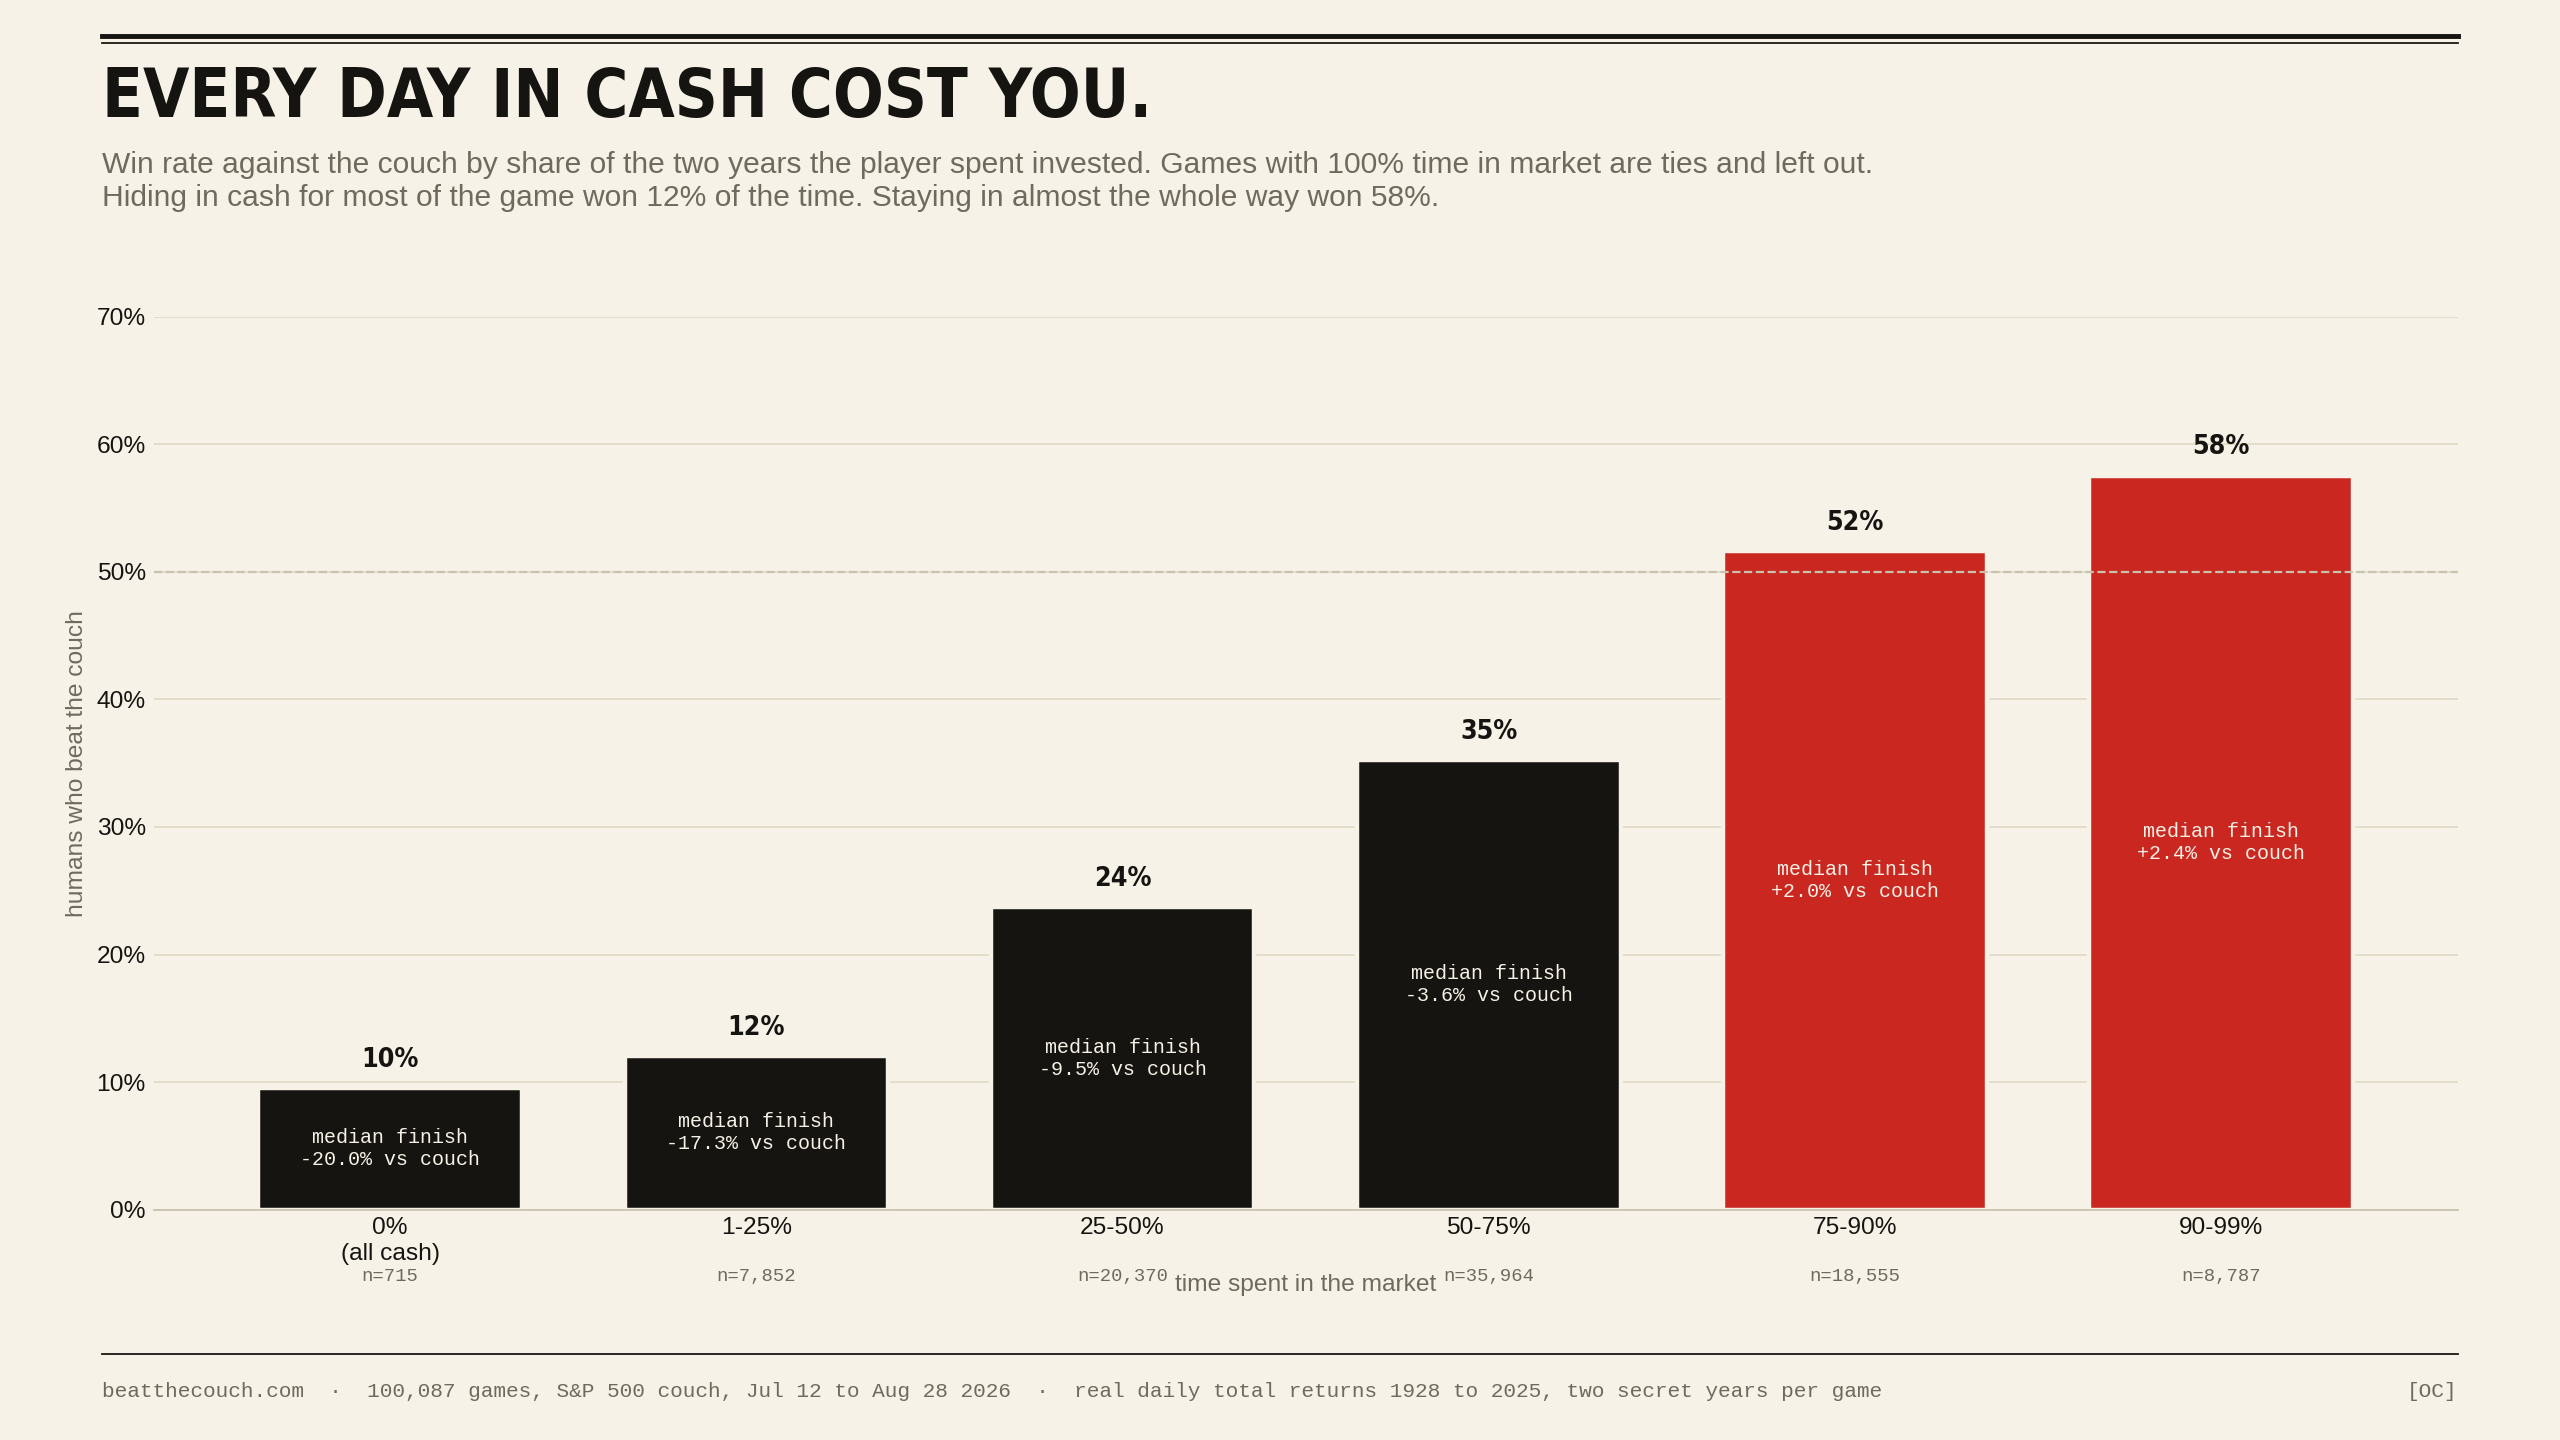
Players who spent under 25% of the window invested won 12% of their games. Players who spent over 90% invested won 58%. The single strongest predictor of beating a buy-and-hold couch is behaving almost exactly like one.
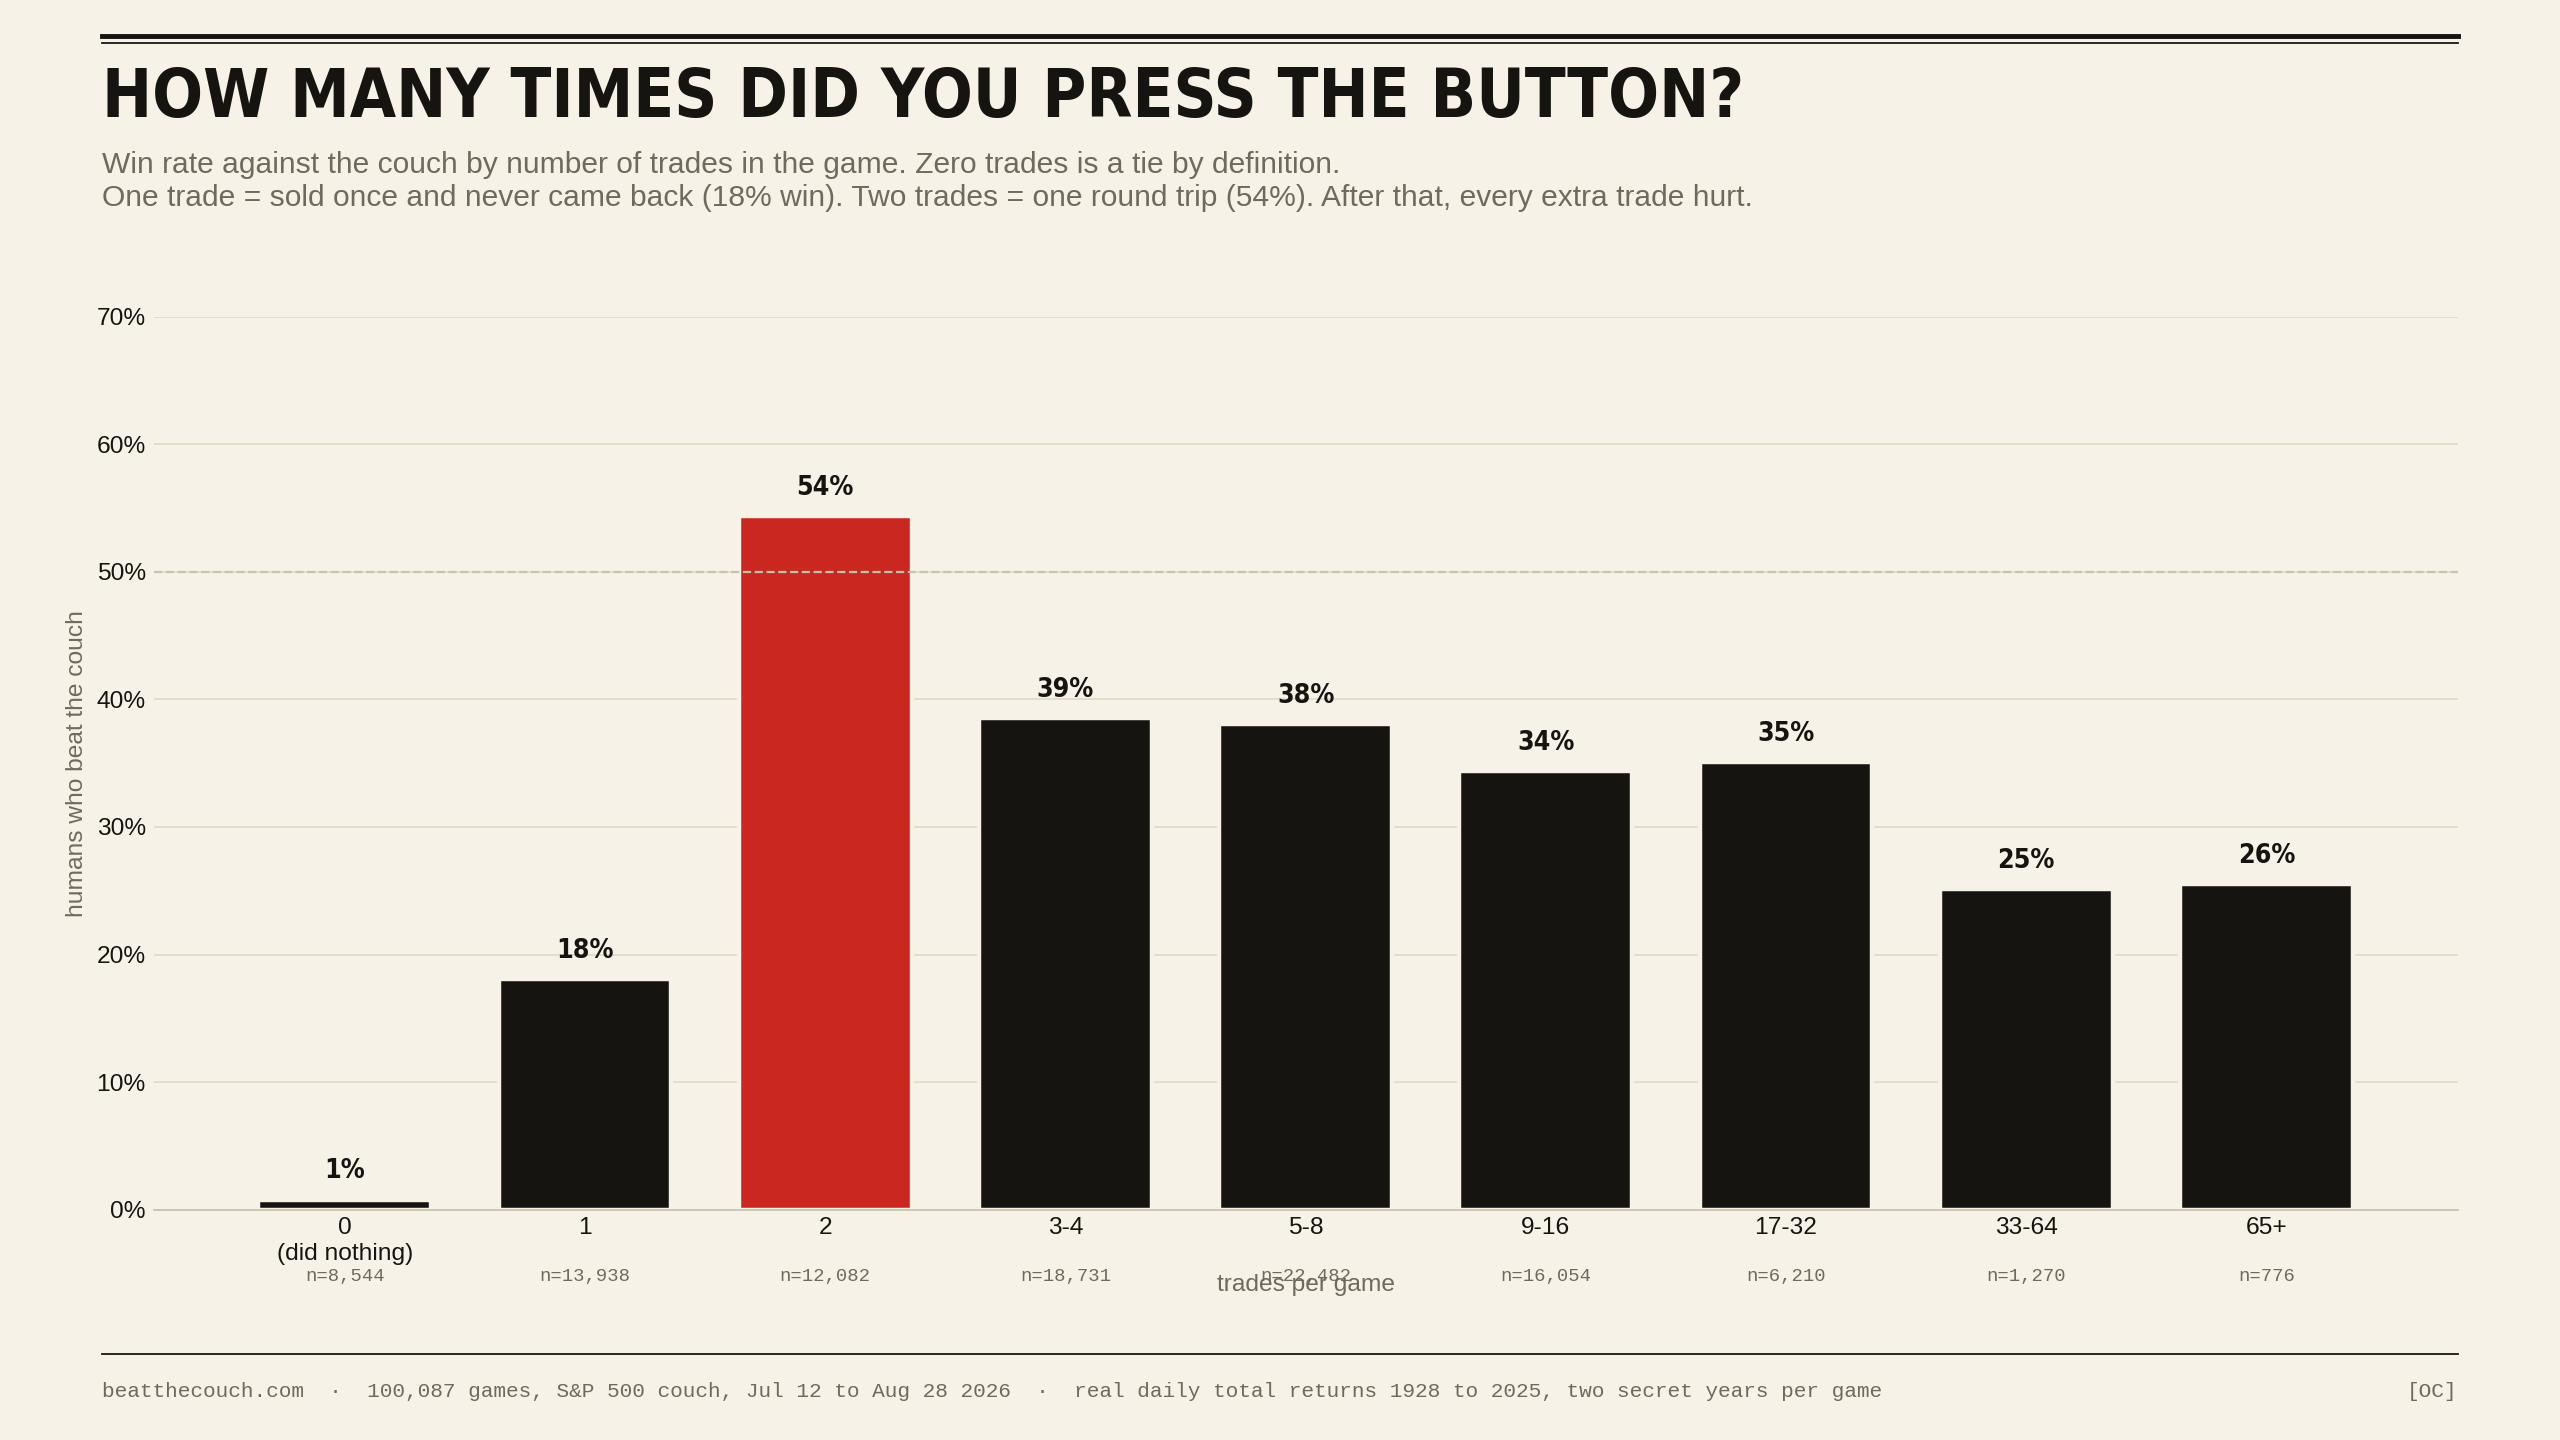
One trade won 18% of the time. Two trades won 54%. Three to eight trades: 38 to 39%. Thirty-three or more: 25%. Two-trade players are self-selected, they are mostly people who saw one obvious crash and stepped out of it once. It is not a strategy, it is a tell.
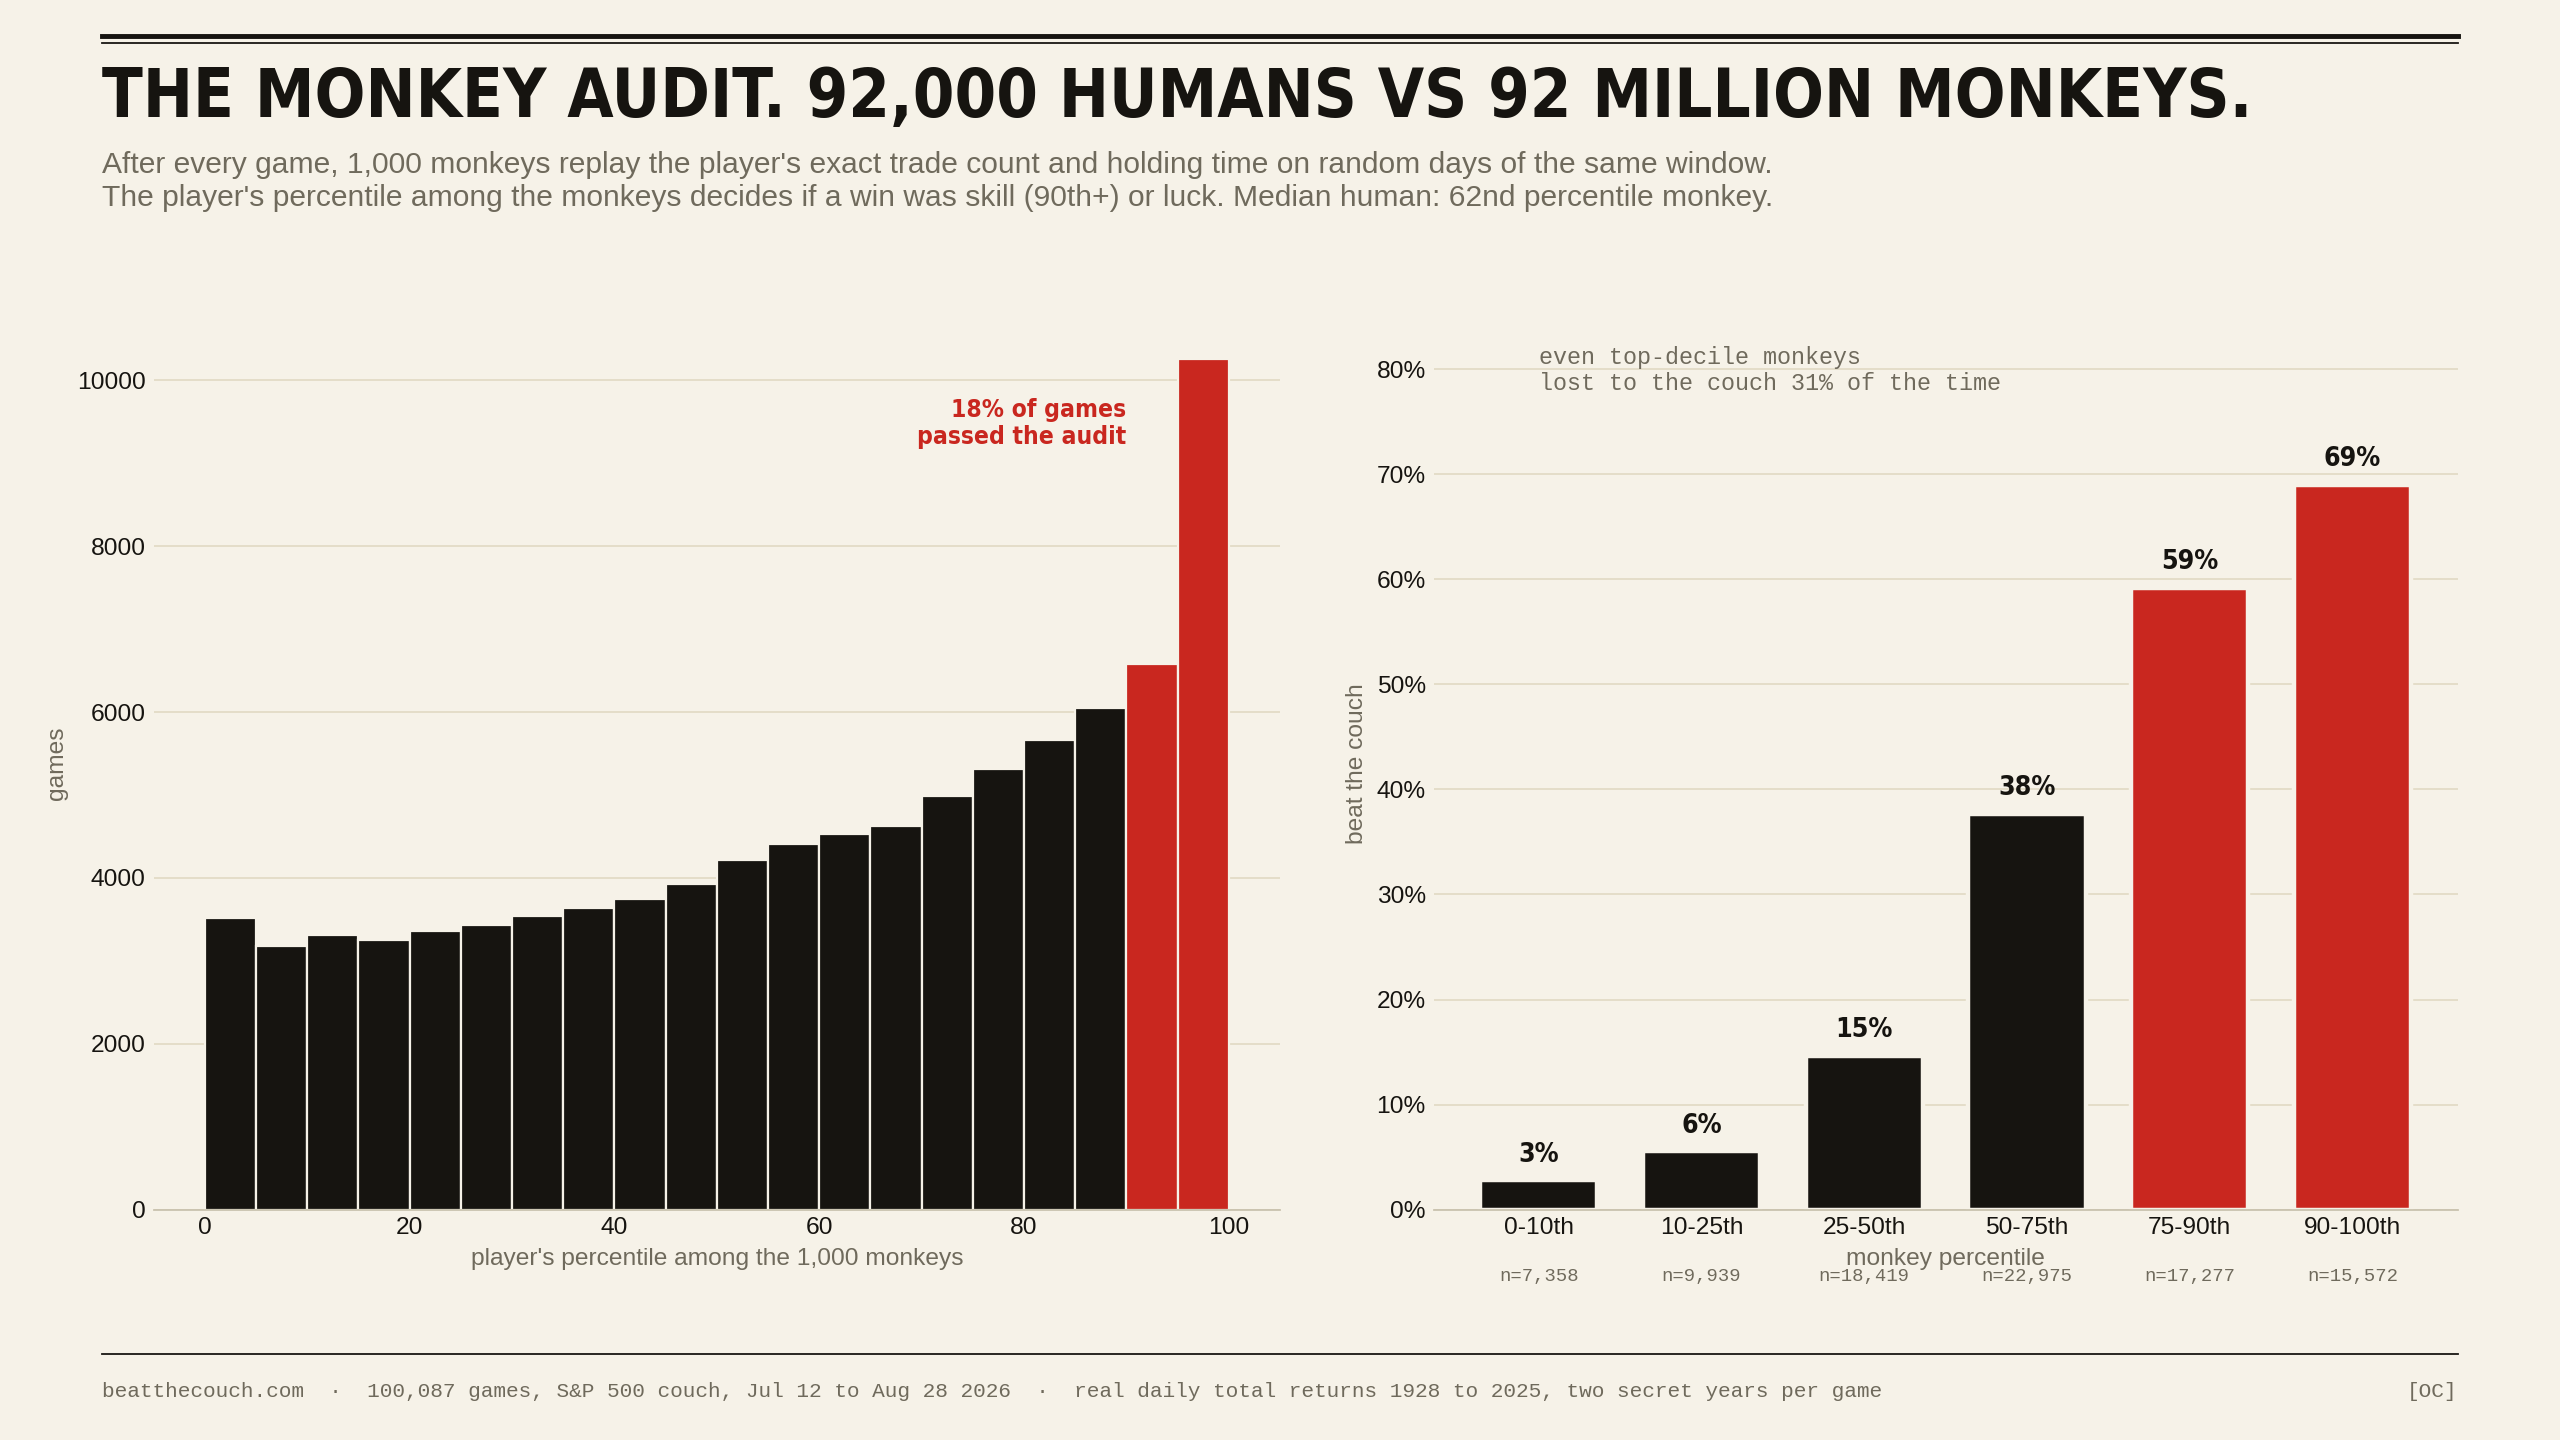
Every win is replayed 1,000 times by monkeys with the same trade count and the same time in the market, on random days of the same window. 18% of audited games cleared the 90th percentile. The median human sits at the 62nd percentile. Roughly two thirds of all human wins fail the audit, which is why the certified-skill line above stays near one game in eight.
Weekly win rate climbed from 32% in launch week to 40 to 44% through August, with no change in trade counts or time in market. Either people learned something the numbers cannot see, or the people who kept losing stopped playing. We cannot separate those two.
Humans ended with less money than they started in 17.4% of games. The couch did in 18.8%. That 1.4 point improvement is the entire prize, and it costs the median player 3.0% of final wealth.
Cut from the 100,087 game export of August 28, 2026. These are conditional rates, sliced by market direction, trade count and start year. The overall split lives in the live scoreboard at the top of this page.
WIN RATE BY MARKET DIRECTION
WIN RATE BY TIME IN MARKET
WIN RATE BY NUMBER OF TRADES
HUMANS vs THE MONKEY AUDIT
WIN RATE BY START YEAR
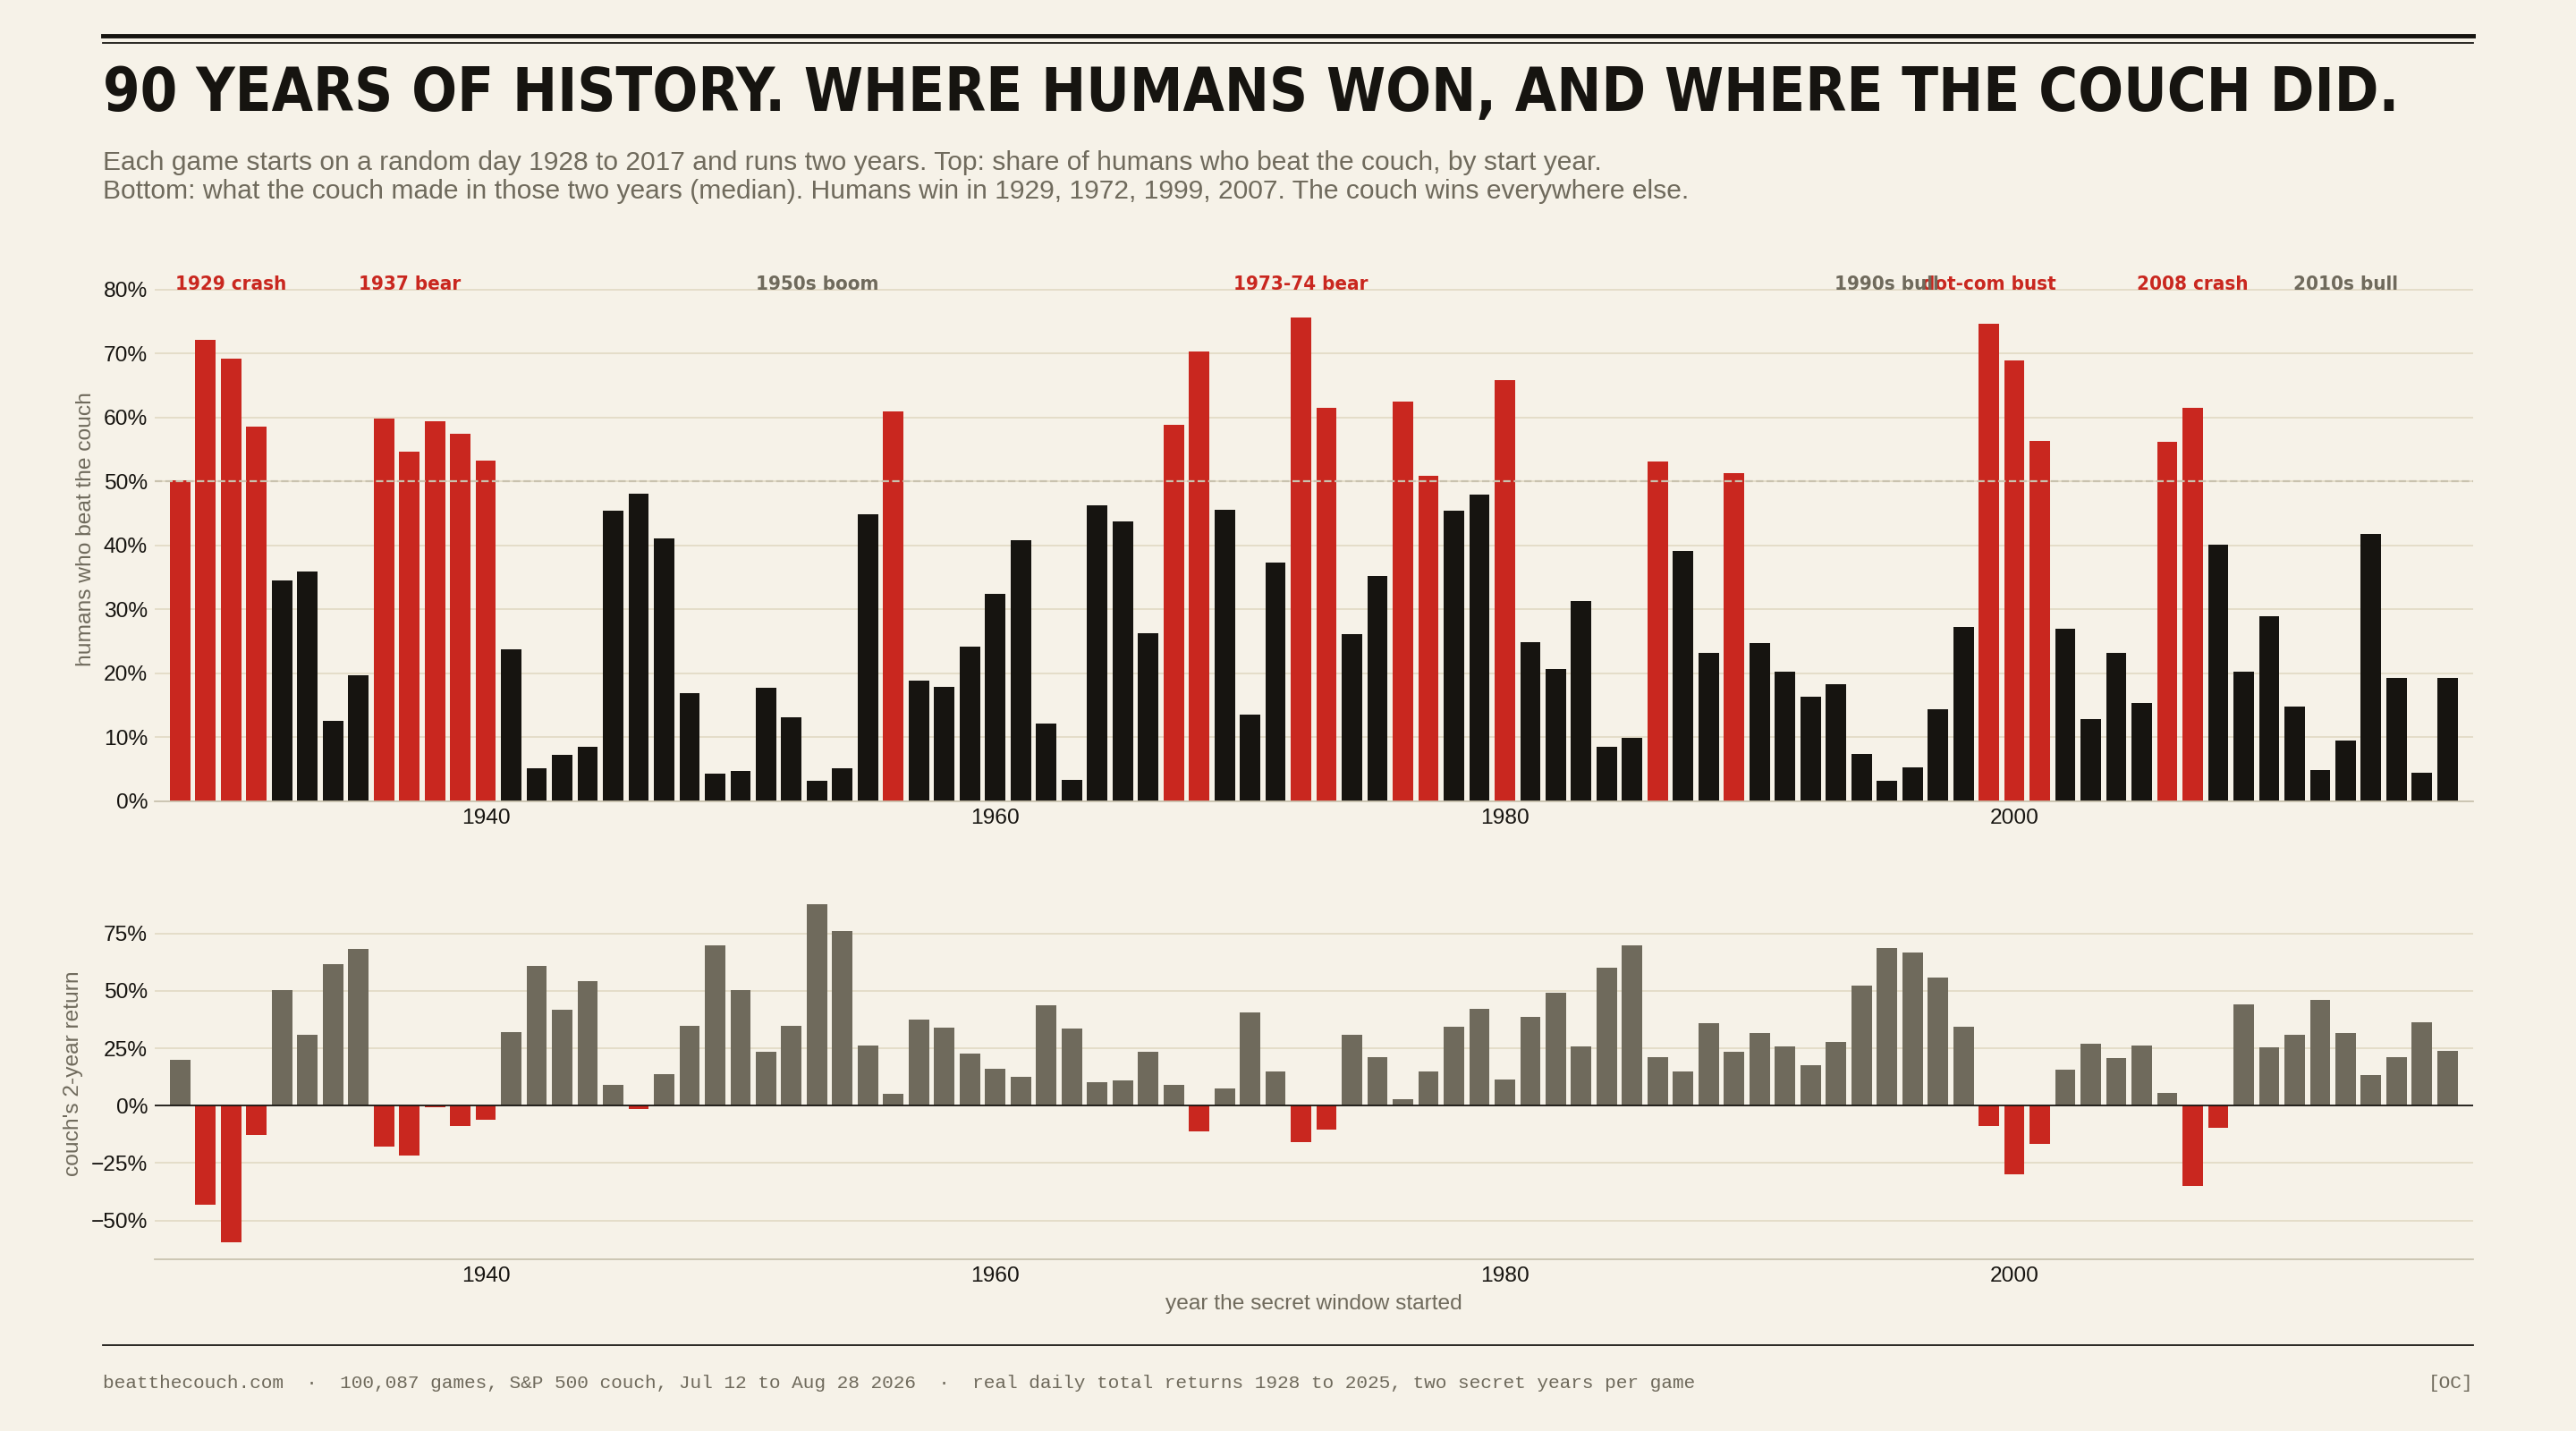
Real S&P 500 daily total returns from 1928 to 2025, dividends included, annual totals calibrated to Damodaran's series; cash earns 3-month T-bills at the rate of the era. Each game is a 504 trading day window drawn at random, dealt blind. The skill audit is a permutation test: 1,000 replays of the player's own trade count and holding time on random days of the same window, with the 90th percentile as the bar.
US large cap only, so survivorship bias is baked in. Players know they are being scored, which is not how anybody invests. Two years is a short window. Everyone plays hindsight-free data with a modern brain. Ten games with 200+ trades inside 90 minutes look like a script and are left in the counts at 10 of 100,087. The random pool was extended to 2025 in August, so windows starting after 2017 have only 21 to 36 games each and are excluded from the by-year chart. This is a game, not a study.
Add a game to the ledgerfree, no signup, about two minutes.Window by window, the same data is broken out in the archive: 1929, Black Monday, the dot-com bubble, 2008 and six more. The research behind all of it is on the evidence page.
BEAT THE COUCH · the game · the archive · the evidence · the data · Privacy · Terms
Not financial advice. The couch is not licensed for anything.